MTEB Results (English)
Model2Vec is evaluated on MTEB, as well as two additional tasks: PEARL (a phrase representation task) and WordSim (a collection of word similarity tasks). The results are shown in the table below. Note: Thepotion and M2V models are our static models.
| Model | Avg (All) | Avg (MTEB) | Class | Clust | PairClass | Rank | Ret | STS | Sum | Pearl | WordSim |
|---|---|---|---|---|---|---|---|---|---|---|---|
| all-MiniLM-L6-v2 | 56.08 | 56.09 | 62.62 | 41.94 | 82.37 | 58.04 | 41.95 | 78.90 | 30.81 | 60.83 | 49.91 |
| potion-base-32M | 52.46 | 51.66 | 65.97 | 35.29 | 78.17 | 50.92 | 33.52 | 74.22 | 29.78 | 55.37 | 55.15 |
| potion-base-8M | 50.54 | 50.03 | 64.44 | 32.93 | 76.62 | 49.73 | 31.71 | 73.24 | 29.28 | 53.54 | 50.75 |
| potion-retrieval-32M | 49.73 | 49.76 | 59.56 | 30.55 | 76.38 | 50.05 | 36.35 | 73.22 | 28.85 | 49.31 | 50.02 |
| potion-base-4M | 48.87 | 48.23 | 62.19 | 31.47 | 75.37 | 48.75 | 29.11 | 72.19 | 28.89 | 52.55 | 49.21 |
| static-retrieval-mrl-en-v1 | 48.18 | 48.36 | 57.39 | 28.32 | 75.63 | 49.16 | 35.61 | 72.18 | 28.64 | 49.68 | 44.76 |
| static-similarity-mrl-multilingual-v1 | 48.15 | 47.15 | 59.96 | 24.40 | 79.02 | 48.25 | 29.54 | 74.88 | 30.28 | 51.66 | 51.66 |
| M2V_base_output | 46.79 | 45.34 | 61.25 | 25.58 | 74.9 | 47.63 | 26.14 | 68.58 | 29.2 | 54.02 | 49.18 |
| potion-base-2M | 45.52 | 44.77 | 58.45 | 27.5 | 73.72 | 46.82 | 24.13 | 70.14 | 31.51 | 50.82 | 44.72 |
| GloVe_300d | 42.84 | 42.36 | 57.31 | 27.66 | 72.48 | 43.3 | 22.78 | 61.9 | 28.81 | 45.65 | 43.05 |
| BPEmb_50k_300d | 39.34 | 37.78 | 55.76 | 23.35 | 57.86 | 43.21 | 17.5 | 55.1 | 29.74 | 47.56 | 41.28 |
encode.
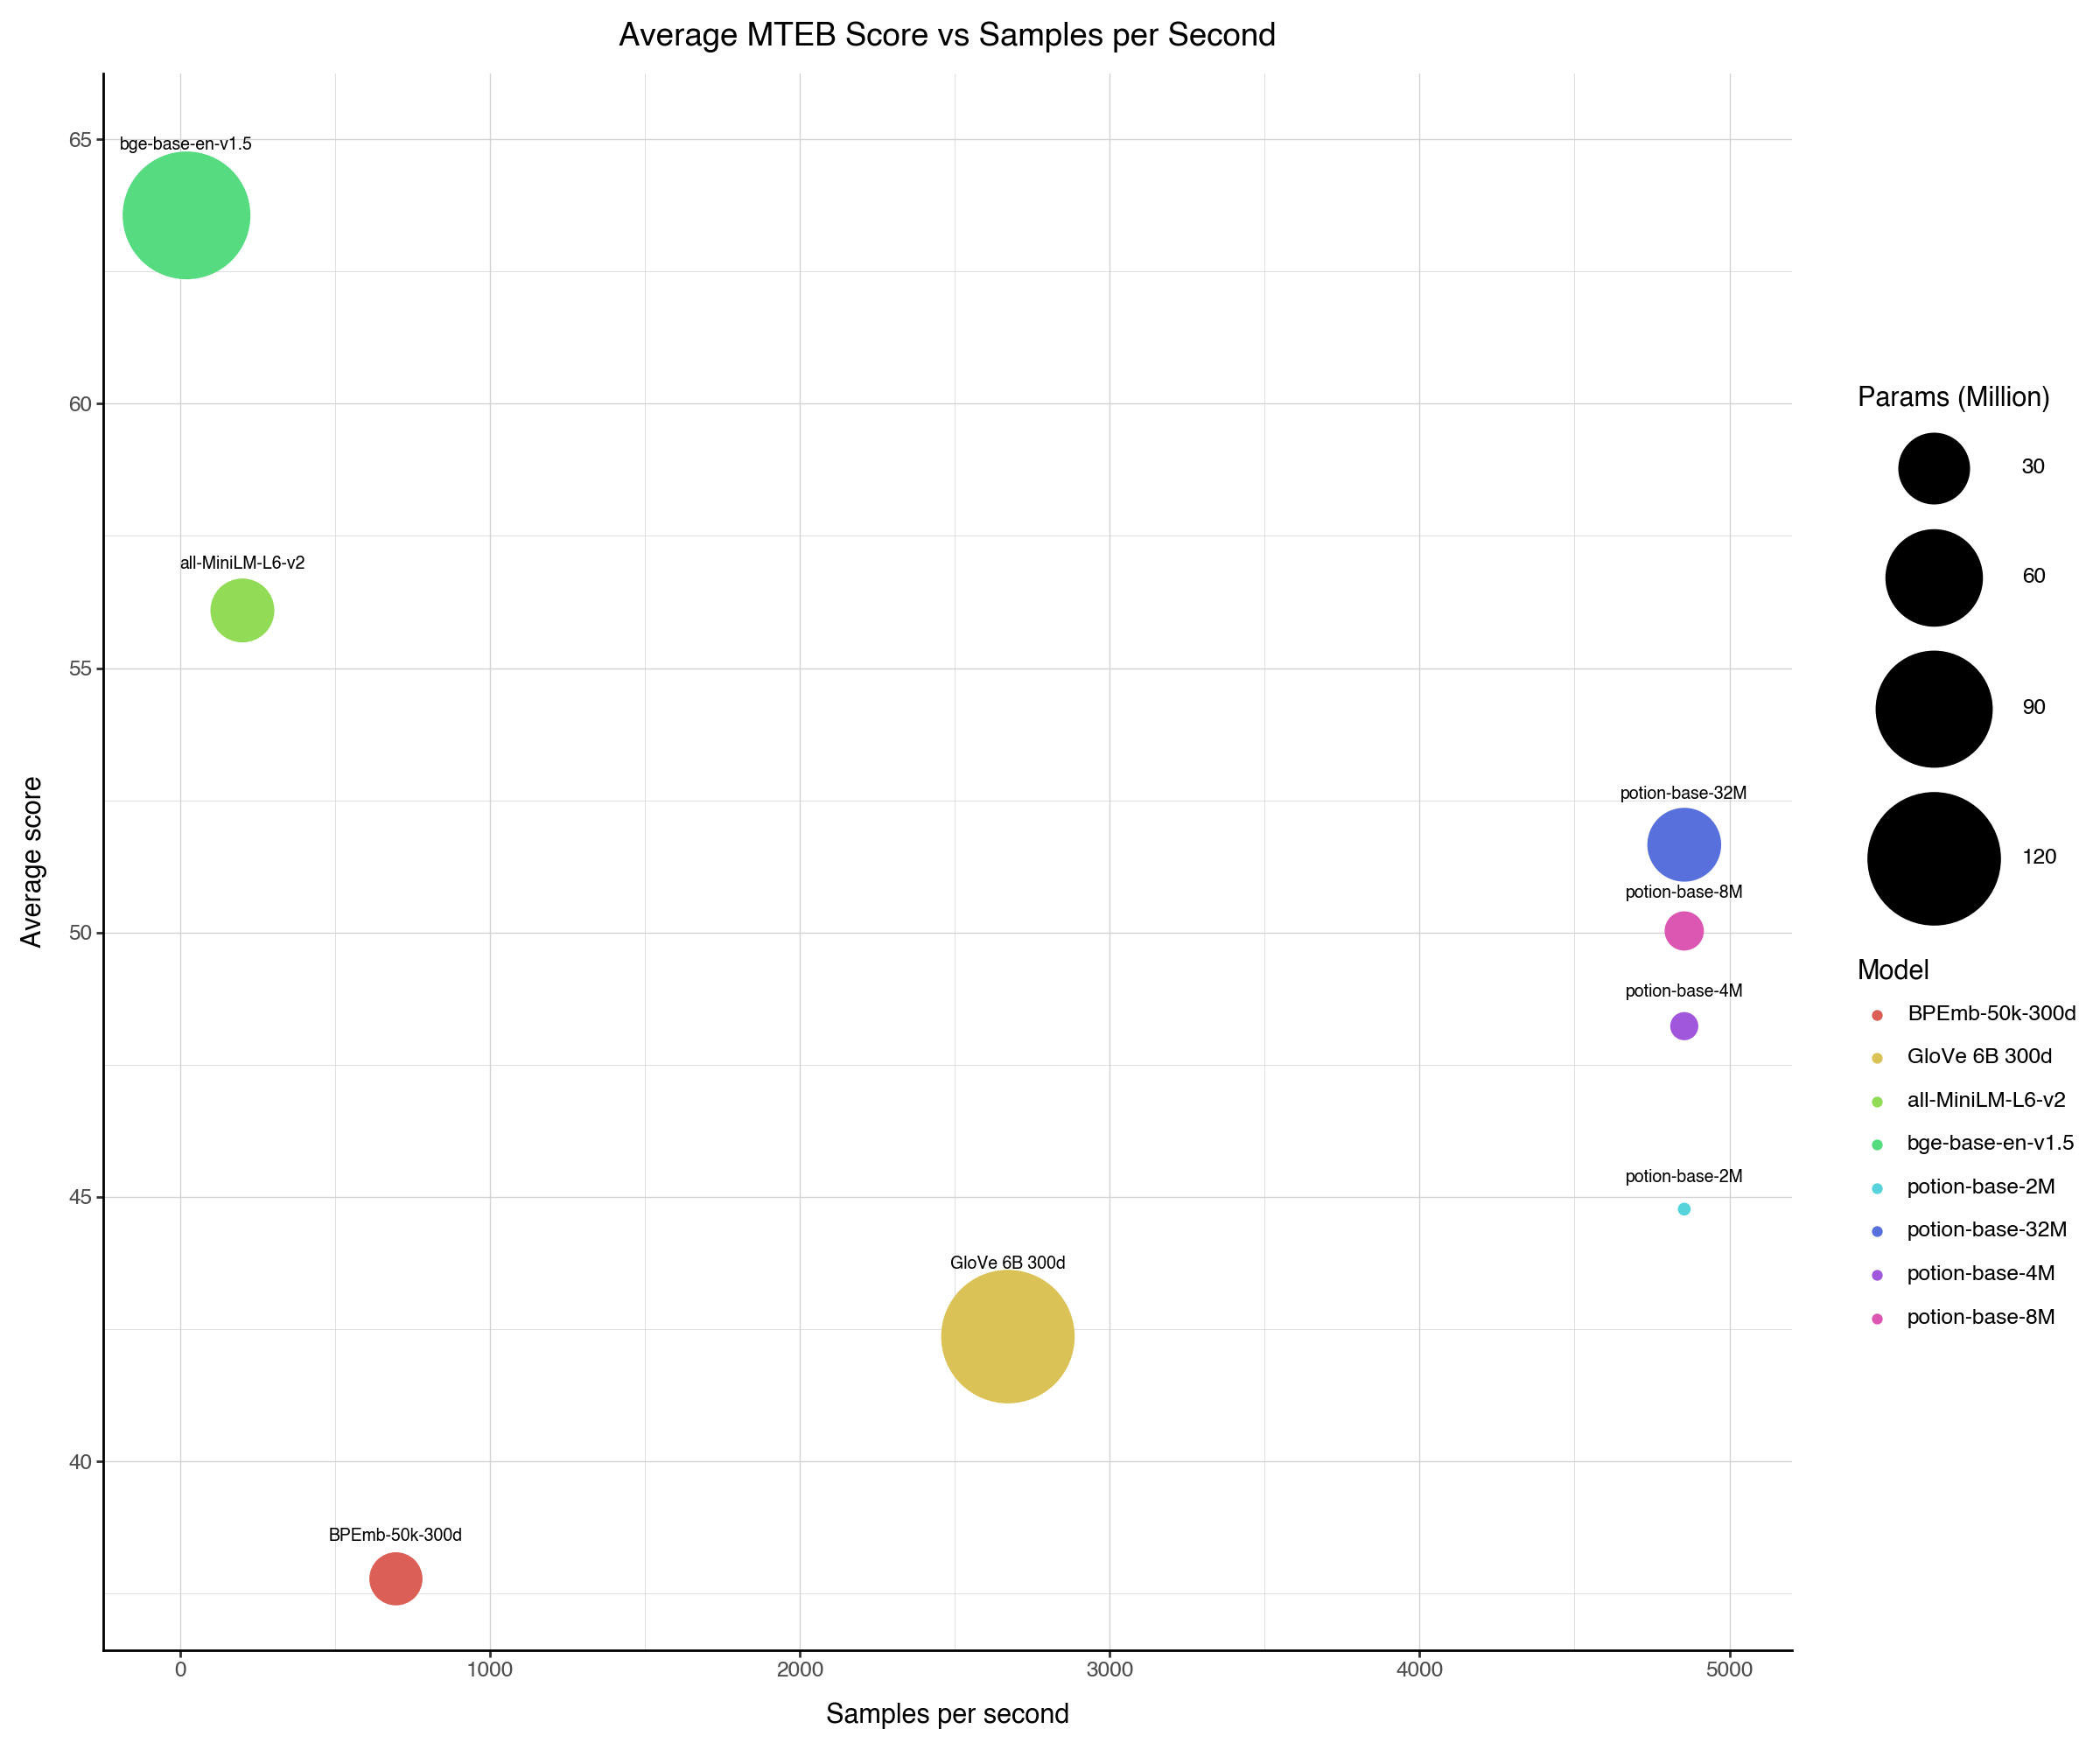 |
|---|
| Figure: The average MTEB score plotted against sentences per second. The circle size indicates model size. |
MMTEB Results (Multilingual)
The results for the multilingual models are shown in the table below. We compare against the LaBSE model, as well as other multilingual static embedding models.| Model | Mean (Task) | Mean (TaskType) | BitMining | Class | Clust | InstRet | MultiClass | PairClass | Rank | Ret | STS |
|---|---|---|---|---|---|---|---|---|---|---|---|
| LaBSE | 52.07 | 45.65 | 76.35 | 54.60 | 38.08 | −3.00 | 20.12 | 75.97 | 50.20 | 33.17 | 65.35 |
| potion-multilingual-128M | 47.31 | 40.40 | 40.72 | 52.36 | 38.80 | −2.08 | 15.95 | 71.39 | 47.39 | 37.86 | 61.23 |
| static-similarity-mrl-multilingual-v1 | 47.24 | 41.38 | 50.62 | 48.60 | 30.67 | −1.24 | 14.74 | 74.34 | 49.45 | 41.21 | 64.02 |
| M2V_multilingual_output | 42.13 | 35.89 | 36.88 | 49.75 | 30.09 | −0.07 | 14.34 | 69.74 | 41.51 | 25.42 | 55.33 |
Retrieval Results
A subset of models we created and compare against are specifically designed for retrieval tasks. The results are shown in the table below, including two general-purpose models for comparison and a transformer.| Model | Retrieval Score |
|---|---|
| all-MiniLM-L6-v2 | 41.95 |
| potion-retrieval-32M | 36.35 |
| static-retrieval-mrl-en-v1 | 35.61 |
| potion-base-32M | 33.52 |
| potion-base-8M | 31.71 |
Training Results
The main results for Model2Vec training are outlined in this section. We compare five different architectures for our main results:model2vec + logreg: A model2vec model with a scikit-learnLogisticRegressionCVon top.model2vec full finetune: A model2vec classifier with the full model finetuned. This uses ourStaticModelForClassification.tfidf: A TF-IDF model with a scikit-learnLogisticRegressionCVon top.setfit: A SetFit model trained using all-minilm-l6-v2 as a base model.bge-base + logreg: A BGE-base encoder model with a scikit-learnLogisticRegressionCVon top.
| dataset | tfidf | model2vec + logreg | model2vec full finetune | setfit | bge-base + logreg |
|---|---|---|---|---|---|
| 20_newgroups | 50.71 | 56.24 | 57.94 | 61.29 | 67.39 |
| ade | 71.46 | 79.20 | 79.68 | 83.05 | 86.12 |
| ag_news | 81.68 | 86.70 | 87.20 | 88.01 | 88.95 |
| amazon_counterfactual | 85.18 | 90.96 | 91.93 | 95.51 | 92.74 |
| bbc | 95.09 | 95.80 | 97.21 | 96.60 | 97.50 |
| emotion | 59.28 | 65.57 | 67.11 | 72.86 | 65.63 |
| enron_spam | 96.00 | 96.40 | 96.85 | 97.45 | 97.30 |
| hatespeech_offensive | 66.45 | 83.54 | 85.61 | 87.69 | 84.92 |
| imdb | 80.44 | 85.34 | 85.59 | 86.00 | 92.25 |
| massive_scenario | 77.26 | 82.86 | 84.42 | 83.54 | 87.07 |
| senteval_cr | 65.61 | 77.03 | 79.47 | 86.15 | 90.53 |
| sst5 | 18.52 | 32.34 | 37.95 | 42.31 | 38.49 |
| student | 74.16 | 83.20 | 85.02 | 89.62 | 89.71 |
| subj | 86.39 | 89.20 | 89.85 | 93.80 | 94.55 |
| tweet_sentiment_extraction | 53.20 | 64.96 | 62.65 | 75.15 | 69.48 |
| tfidf | model2vec + logreg | model2vec full finetune | setfit | bge-base + logreg | |
|---|---|---|---|---|---|
| average | 70.8 | 78.0 | 79.2 | 82.6 | 82.8 |
potion-base-32m, and to use full fine-tuning if you are starting from another base model.
The speed difference between model2vec and the other models is immeense, with the full finetune being 35x faster than a setfit based on all-minilm-l6-v2 on CPU and 200x faster than thebge-base transformer model.
| tfidf | model2vec + logreg | model2vec full finetune | setfit | bge-base + logreg | |
|---|---|---|---|---|---|
| samples / second | 108434 | 17925 | 24744 | 716 | 118 |
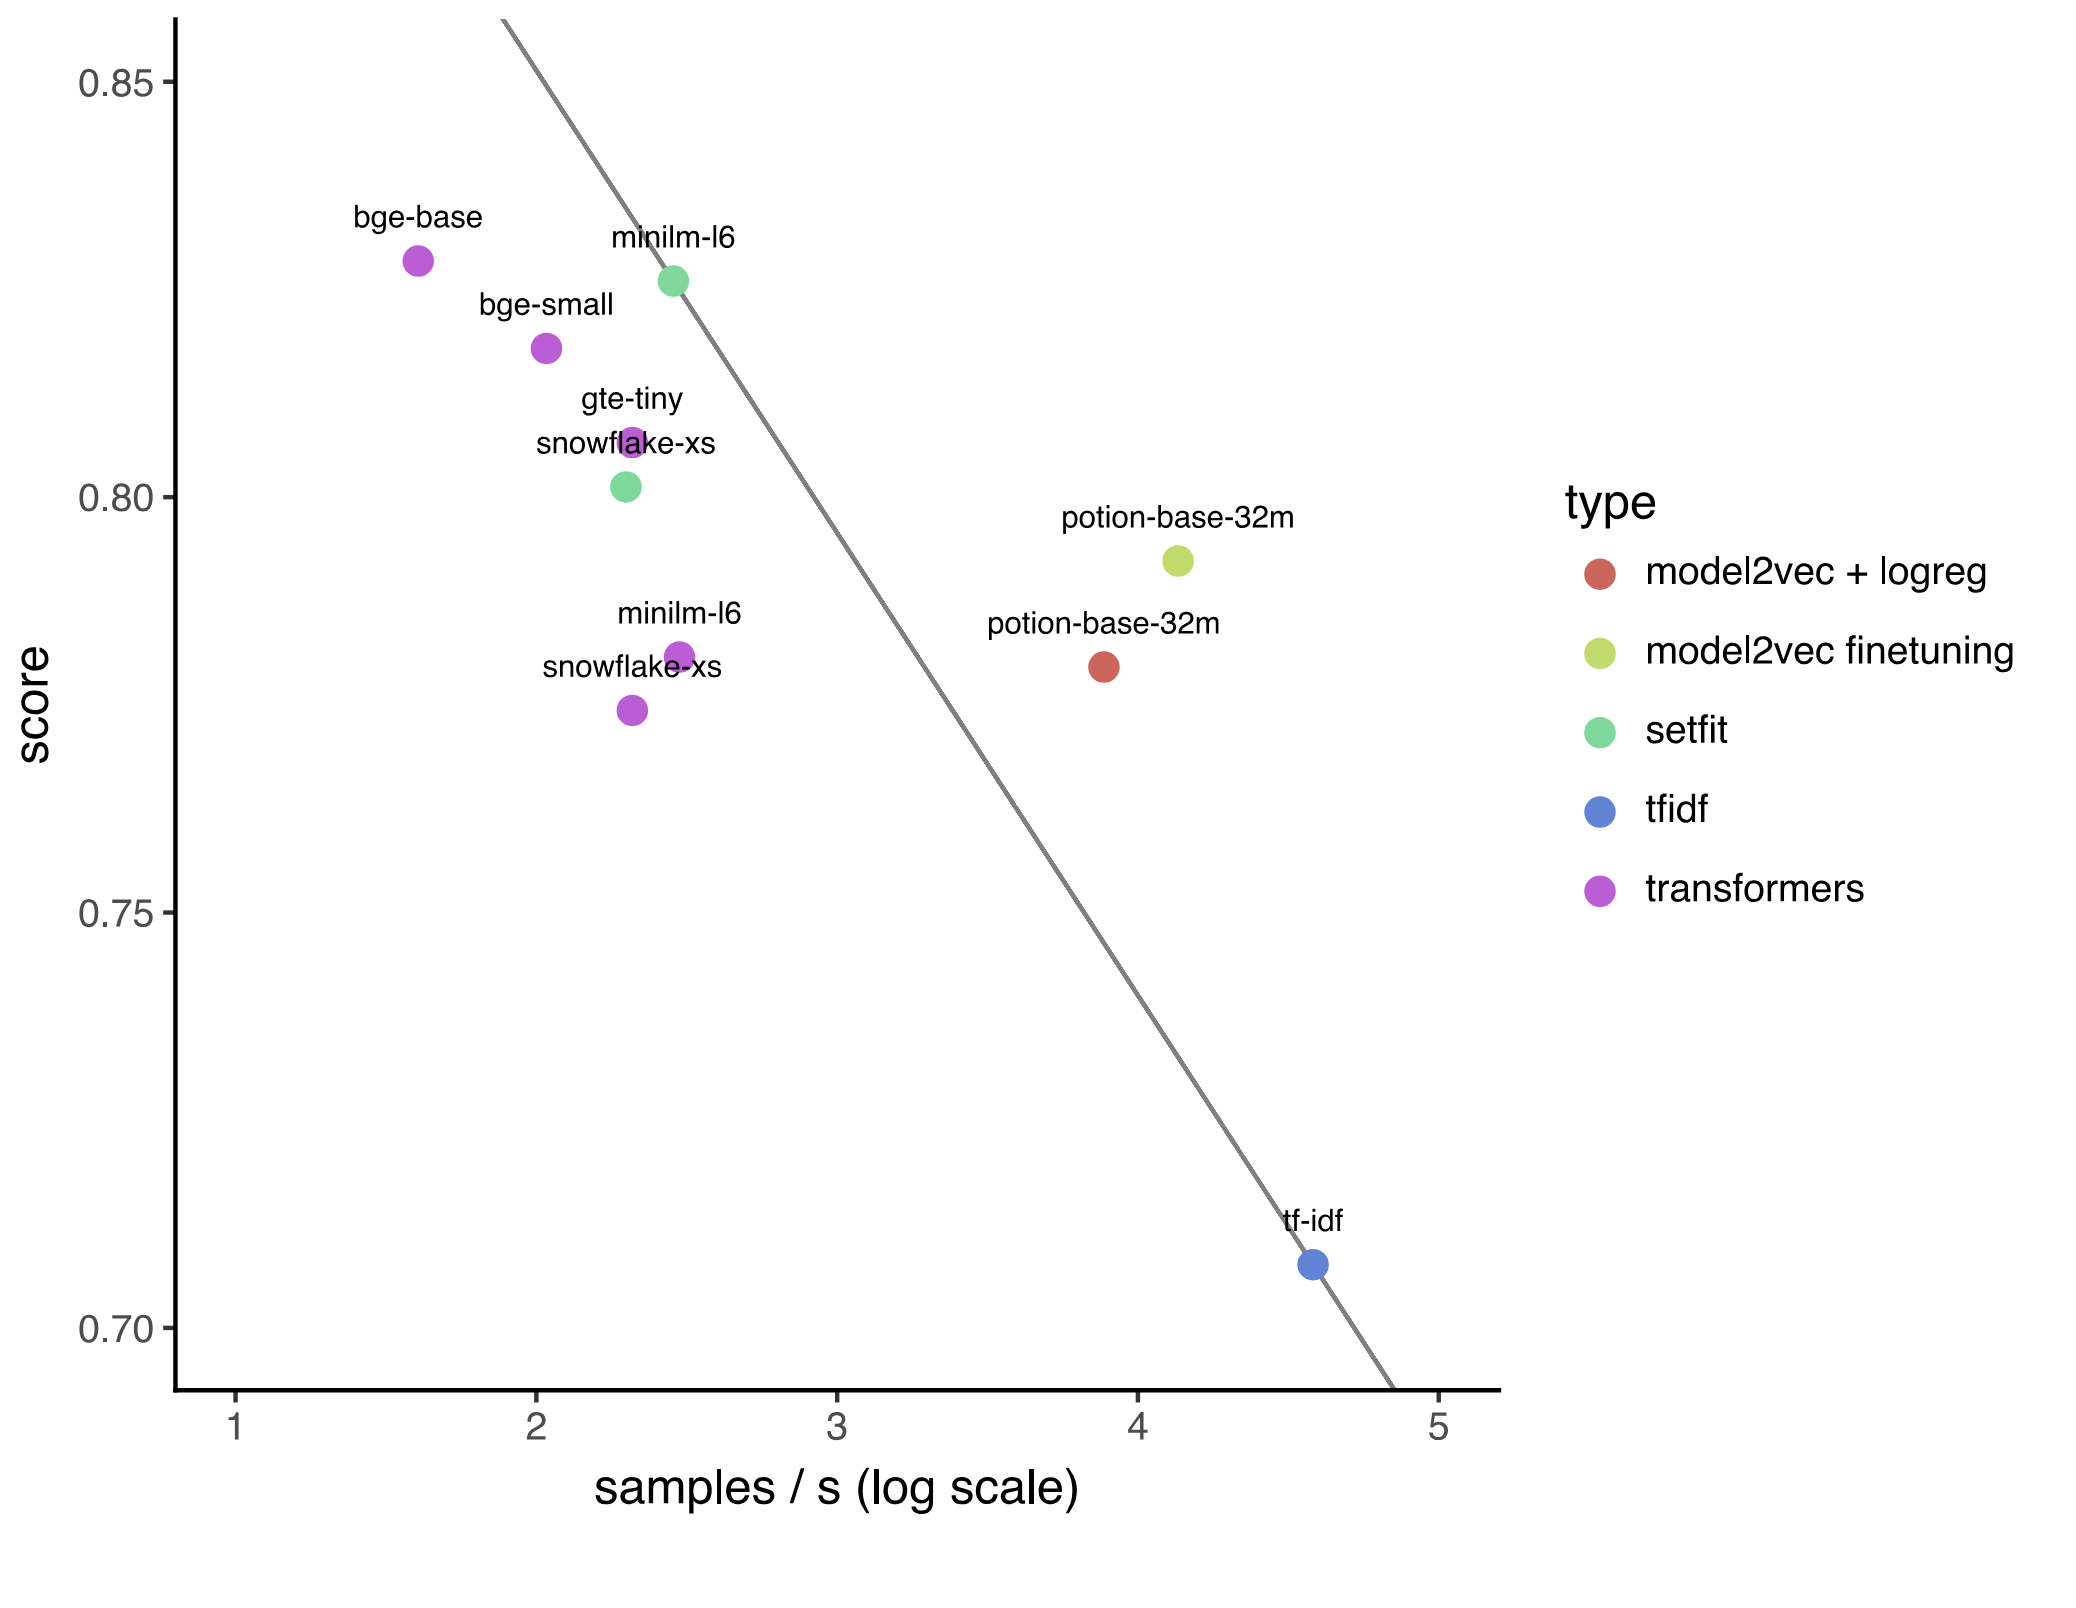 |
|---|
| Figure: The average training score plotted against sentences per second (log scale). |
Ablations
To better understand the factors contributing to the performance of Model2Vec, we conducted a comprehensive set of ablation studies, covering various aspects of the model’s architecture and preprocessing methods. In these studies, we examined the impact of key elements such as PCA, Zipf weighting, and the use of Sentence Transformers versus regular transformer models. We also compared the performance of input embeddings versus output embeddings, since it would seem plausible that these should also work well. The results are shown in the table below.| Model | Avg (All) | Avg (MTEB) | Class | Clust | PairClass | Rank | Ret | STS | Sum | Pearl | WordSim |
|---|---|---|---|---|---|---|---|---|---|---|---|
| M2V_base_output | 46.79 | 45.34 | 61.25 | 25.58 | 74.9 | 47.63 | 26.14 | 68.58 | 29.2 | 54.02 | 49.18 |
| M2V_base_output_nopca | 44.04 | 42.31 | 61.42 | 20.15 | 68.21 | 44.67 | 25.25 | 61.87 | 29.85 | 51.02 | 48.96 |
| M2V_base_output_nozipf | 43.61 | 41.52 | 60.44 | 21.62 | 72.15 | 45.57 | 20.35 | 62.71 | 30.66 | 52.28 | 49.17 |
| M2V_base_input_nozipf_nopca | 40.97 | 39.55 | 54.16 | 18.62 | 68.3 | 43.65 | 23.63 | 59.38 | 32.04 | 50.19 | 40.52 |
| M2V_base_output_nozipf_nopca | 40.8 | 38.44 | 59.78 | 19.31 | 62.39 | 42.26 | 19.01 | 55.16 | 30 | 49.09 | 48.97 |
| M2V_base_input | 40.74 | 39.93 | 60.35 | 22.66 | 59.63 | 43.02 | 25.47 | 50.05 | 29.35 | 50.61 | 34.47 |
| M2V_bert_output_nozipf_nopca | 35.54 | 34.82 | 55.69 | 15.42 | 58.68 | 39.87 | 12.92 | 55.24 | 30.15 | 46.9 | 26.72 |
- Non-Sentence Transformers do not work well. This can be seen by comparing
M2V_bert_output_nozipf_nopca(which uses BERT, a non-Sentence Transformer) andM2V_base_output_nozipf_nopca(which uses BGE-base, a Sentence Transformer). Using a Sentence Transformer gives a ~5.2% increase in performance. - PCA is crucial for performance. This can be seen by comparing
M2V_base_output_nozipf_nopcaandM2V_base_output_nozipfwhich gives a ~2.8% increase in performance. Furthermore, PCA improves performance on all tasks. - Zipf weighting is crucial for performance. This can be seen by comparing
M2V_base_output_nozipf_nopcaandM2V_base_output_nopcawhich gives a ~3.1% increase in performance. - Output embeddings outperform input embeddings. This can be seen by comparing
M2V_base_inputandM2V_base_outputwhich gives a ~6.1% increase in performance. Note that input embeddings do work well for some tasks. We hypothesize that this is because input embeddings are inherently normalized.